


When is it a good time to buy growth stocks?
Here's how I know when to have my foot on the gas trading aggressively, and when to go on vacation

I use 4 simple tools to guide me
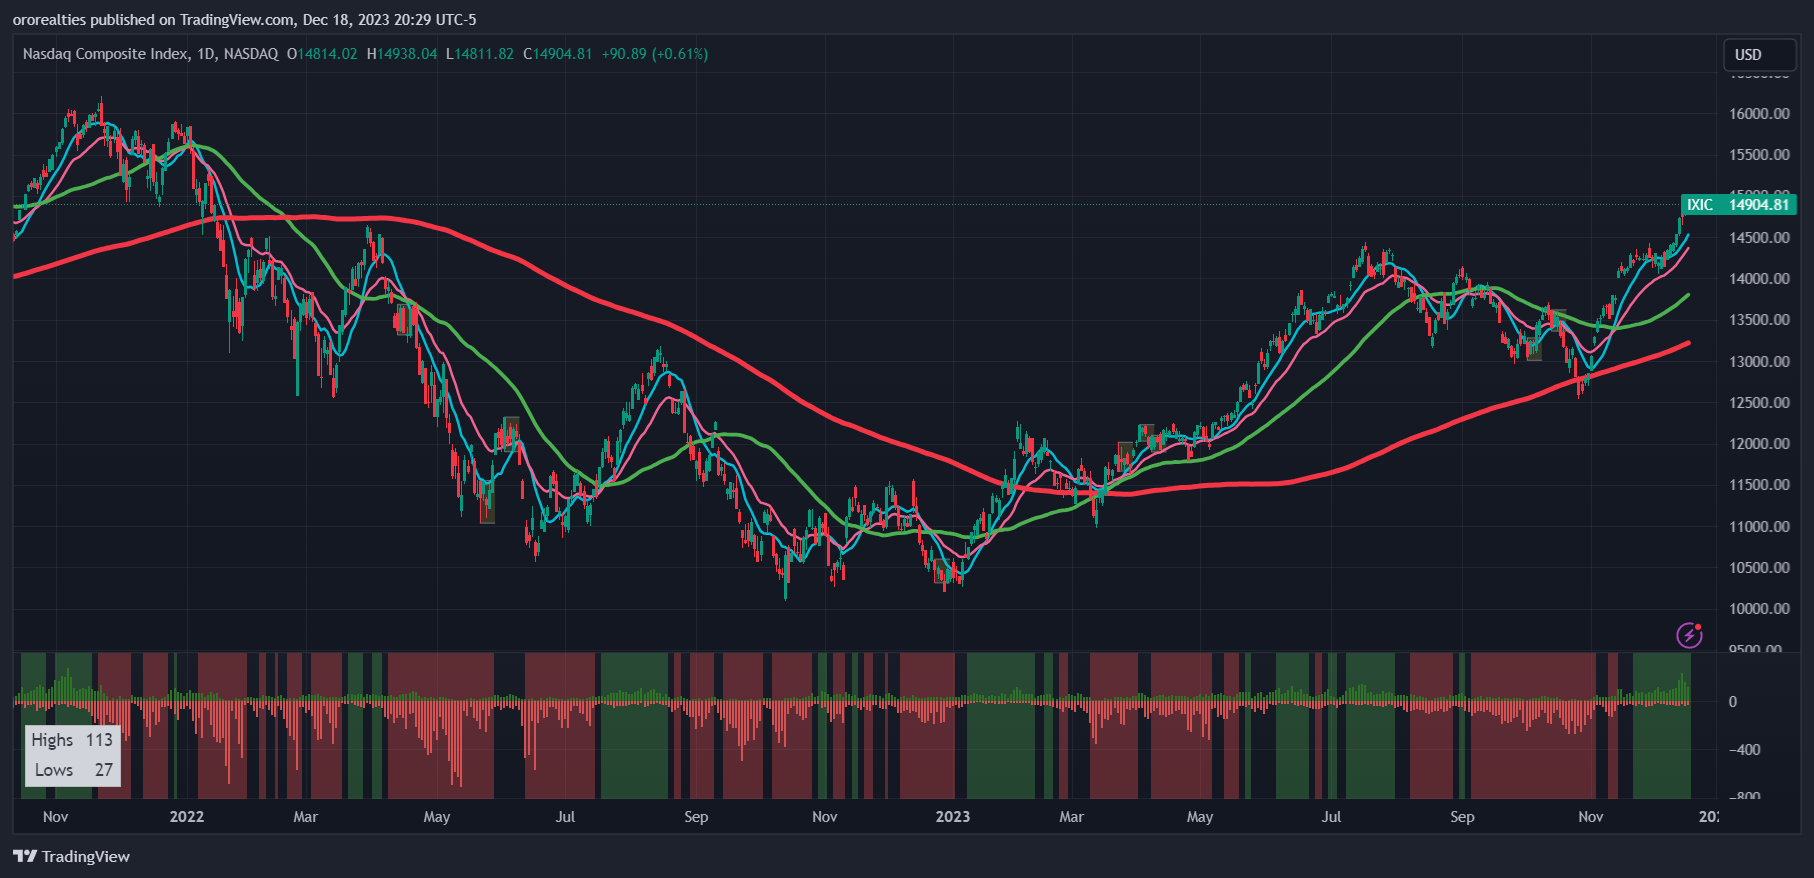
Trend of the indexes (QQQ most important)
The NASI oscillator
The Net high/Net low readings of the market
Tracking leading sectors and stocks
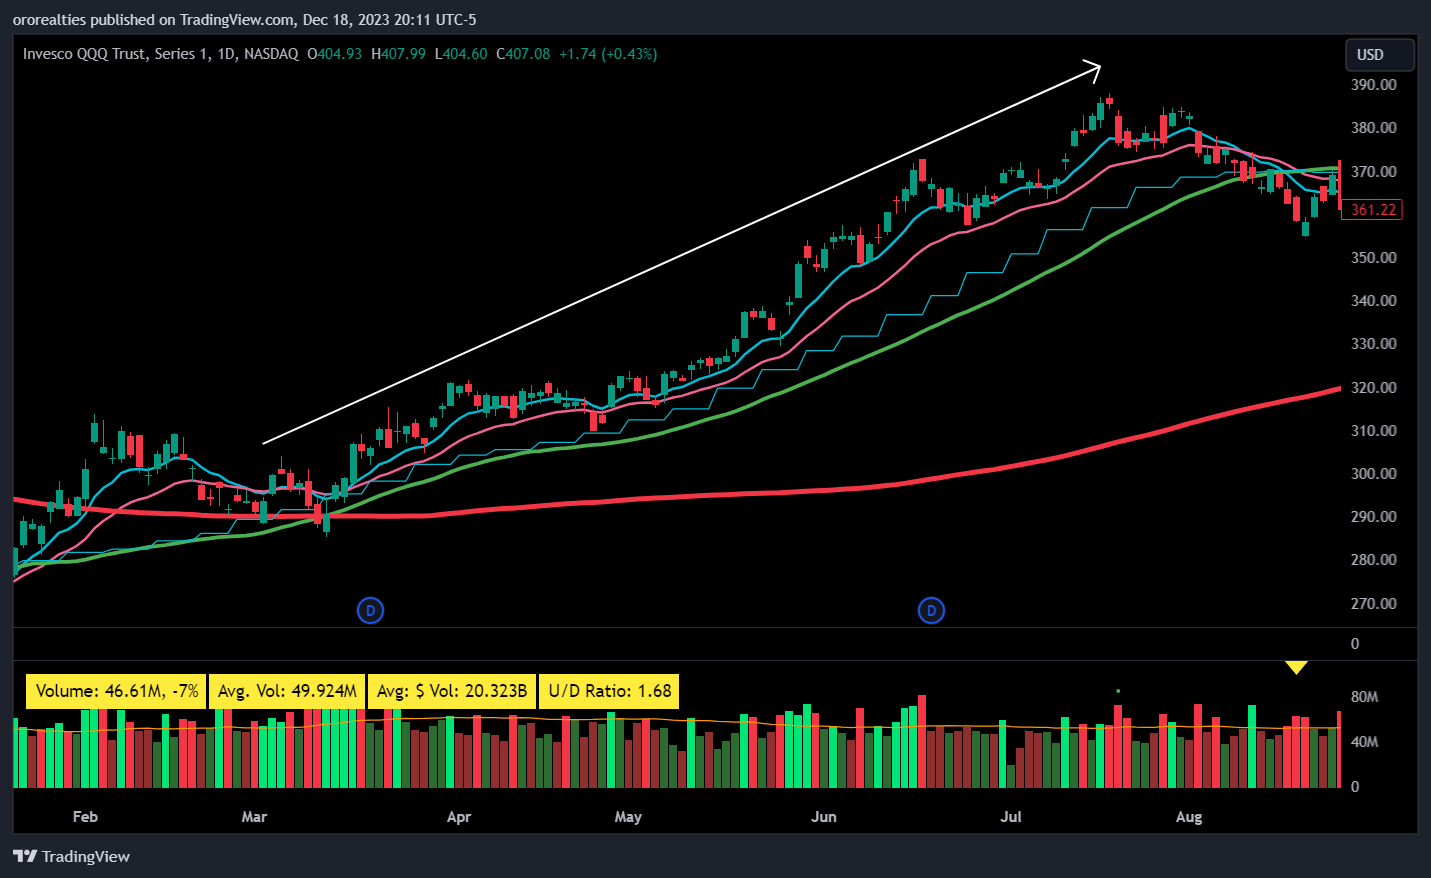
The big money is made in the stock market when the indexes (QQQ most importantly) are trading above their rising 10/21 exponential moving averages. This is because you’re buying stocks with the wind at your back.
The trend of the general market is of the utmost importance. When it is rising, you want to be buying. When it is sideways, you want to be observing or managing open positions, and when it’s down trending, you want to be in cash or short.
Here’s March-August this year, with a strong uptrend in the QQQ, above rising 10/21ema’s. Many growth stocks had excellent moves during this period.
Now here’s a glimpse of last year’s bear market with persistent selling
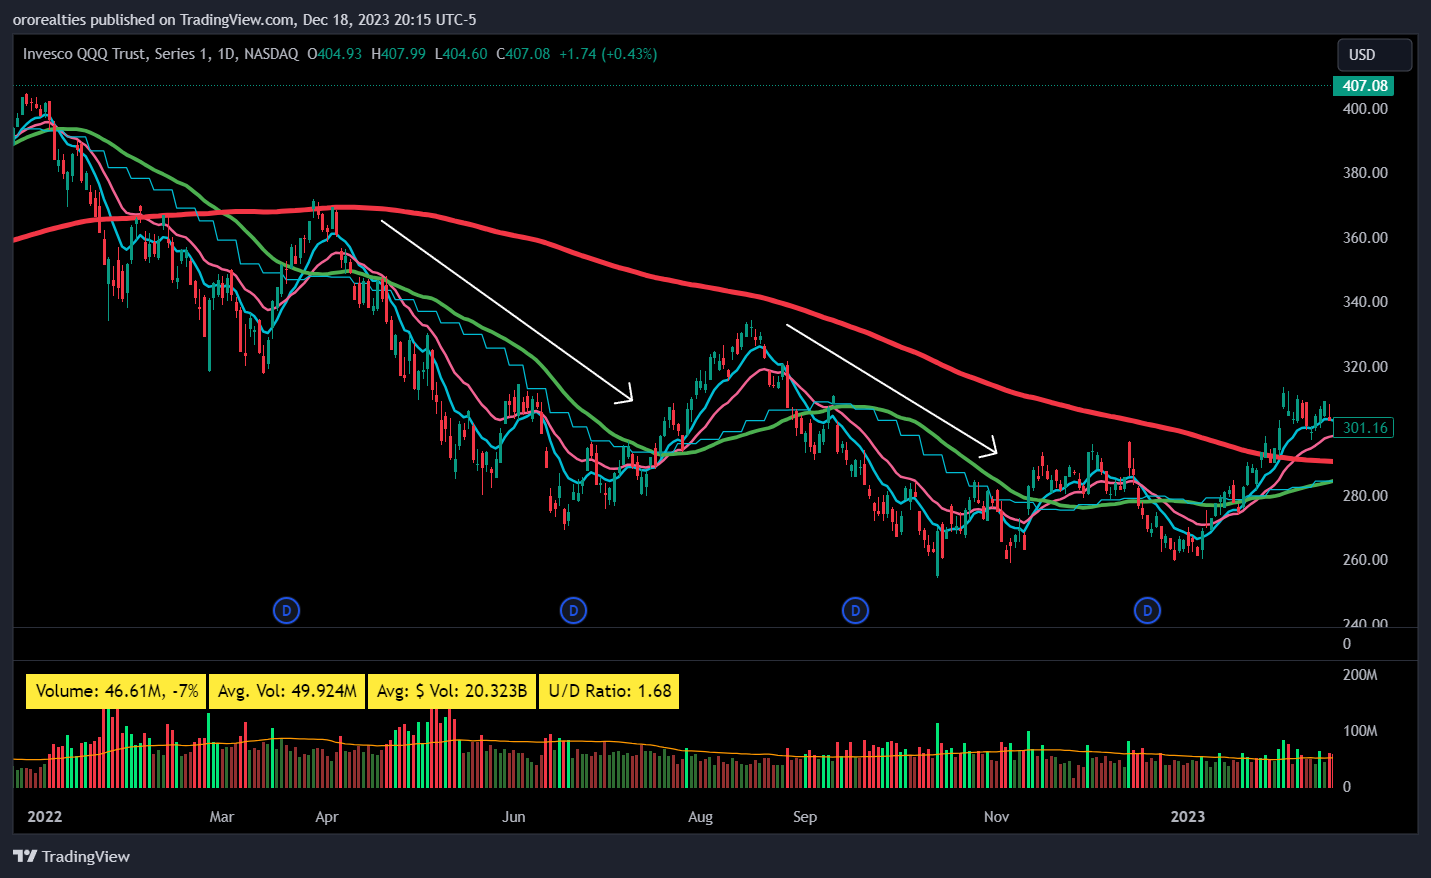
The direction of the moving averages are absolutely critical.
2. The NASI
The McClellan Summation Index (NASI) is a breadth indicator derived from the McClellan Oscillator, which is a breadth indicator based on Net Advances (advancing issues less declining issues).
When the indicator is rising and on a buy signal (black), it tells us there are more stocks advancing than declining. The inverse occurs for the downside. It is my go-to indicator to see what’s going on under the hood of the market.

Net highs / Net lows readings
This tool refers is the best way of seeing what’s really going on underneath the hood of the Nasdaq. It simple shows if there are more stocks making new highs than new lows.
See this chart below - what do you notice about the trend of the market when the readings are green (net highs), and when they’re red (net lows)?
We see that the market trends when we have persistent net highs! When the readings are negative, the market is horribly choppy or trending down.

Take a look at the covid crash (bottom left) and the readings following that…. some of the most powerful net high readings! Look at the tremendous run the market went on following this! Why? Stocks kept making new highs.

Now how about the 2022 bear market. What do you see here? I see a market dominated with lots of net low readings (red), hence the downward trend.
These are the only tools I use to guide my activity levels - as well as the progress in my account. I would like to recognize the work of Matt Caruso and John Boik, the first people to introduce these concepts to me.
Leading Stocks & Sectors
The presence of leadership is critical to our buying process - we want to see themes emerging, as that provides the strongest opportunities and probability of further upside.
Once we identify a leading group, we always want to dial in to the liquid leaders. An example would be the dominant reign of the Semiconductors group in recent times, with NVDA being the leader.
Please reach out for any questions.
Best,
Francesco
Sounds like a great idea for a mobile application that takes these points and spits out a to trade or not to trade today recommendation. 🤔
Hi Francesco.
When 1 out of these 3 indicators is "red", then your Market Timing System Signal is yellow, rigth?
Ps: I'm referring to a QQQ chart you posted with these three colors as the background.
Thank you.