


Rally tags 200-day resistance - Now I'm ready for pullback buy setups!
Time to stalk like a lion, and wait for those pullback buys.

The markets saw a ferocious lockout rally take place this week, with strong action in leaders.
There were no consolidations or pauses to be found, as stocks and indexes charged higher. The rubber now meets the road of this rally, as we come straight into the 200-day moving average.
Now, the fun part: getting ready to stalk for pullback buys!
We are in the thick of earnings season, with lots of high-quality names reporting next week— there are going to be some amazing opportunities from an exciting crop of new names.
The first push of this move is over, and comes the discipline to let these leaders digest— The last thing you want to do is get too aggressive on the tail end of a move.
The leaders have been screaming out to us loud and clear, and now we are on the hunt for tight entries and pullbacks to work with.
The plan ahead is very clear - let’s go!
Ps. Next week, I’ll be recording a chat with USIC 2024 top performer Christian Flanders, who returned a staggering 433%!
We’ll be talking markets so far in 2025, how Christian managed the chop/correction, his approach, and what he’s seeing in the market now.
It will be awesome - stay tuned!

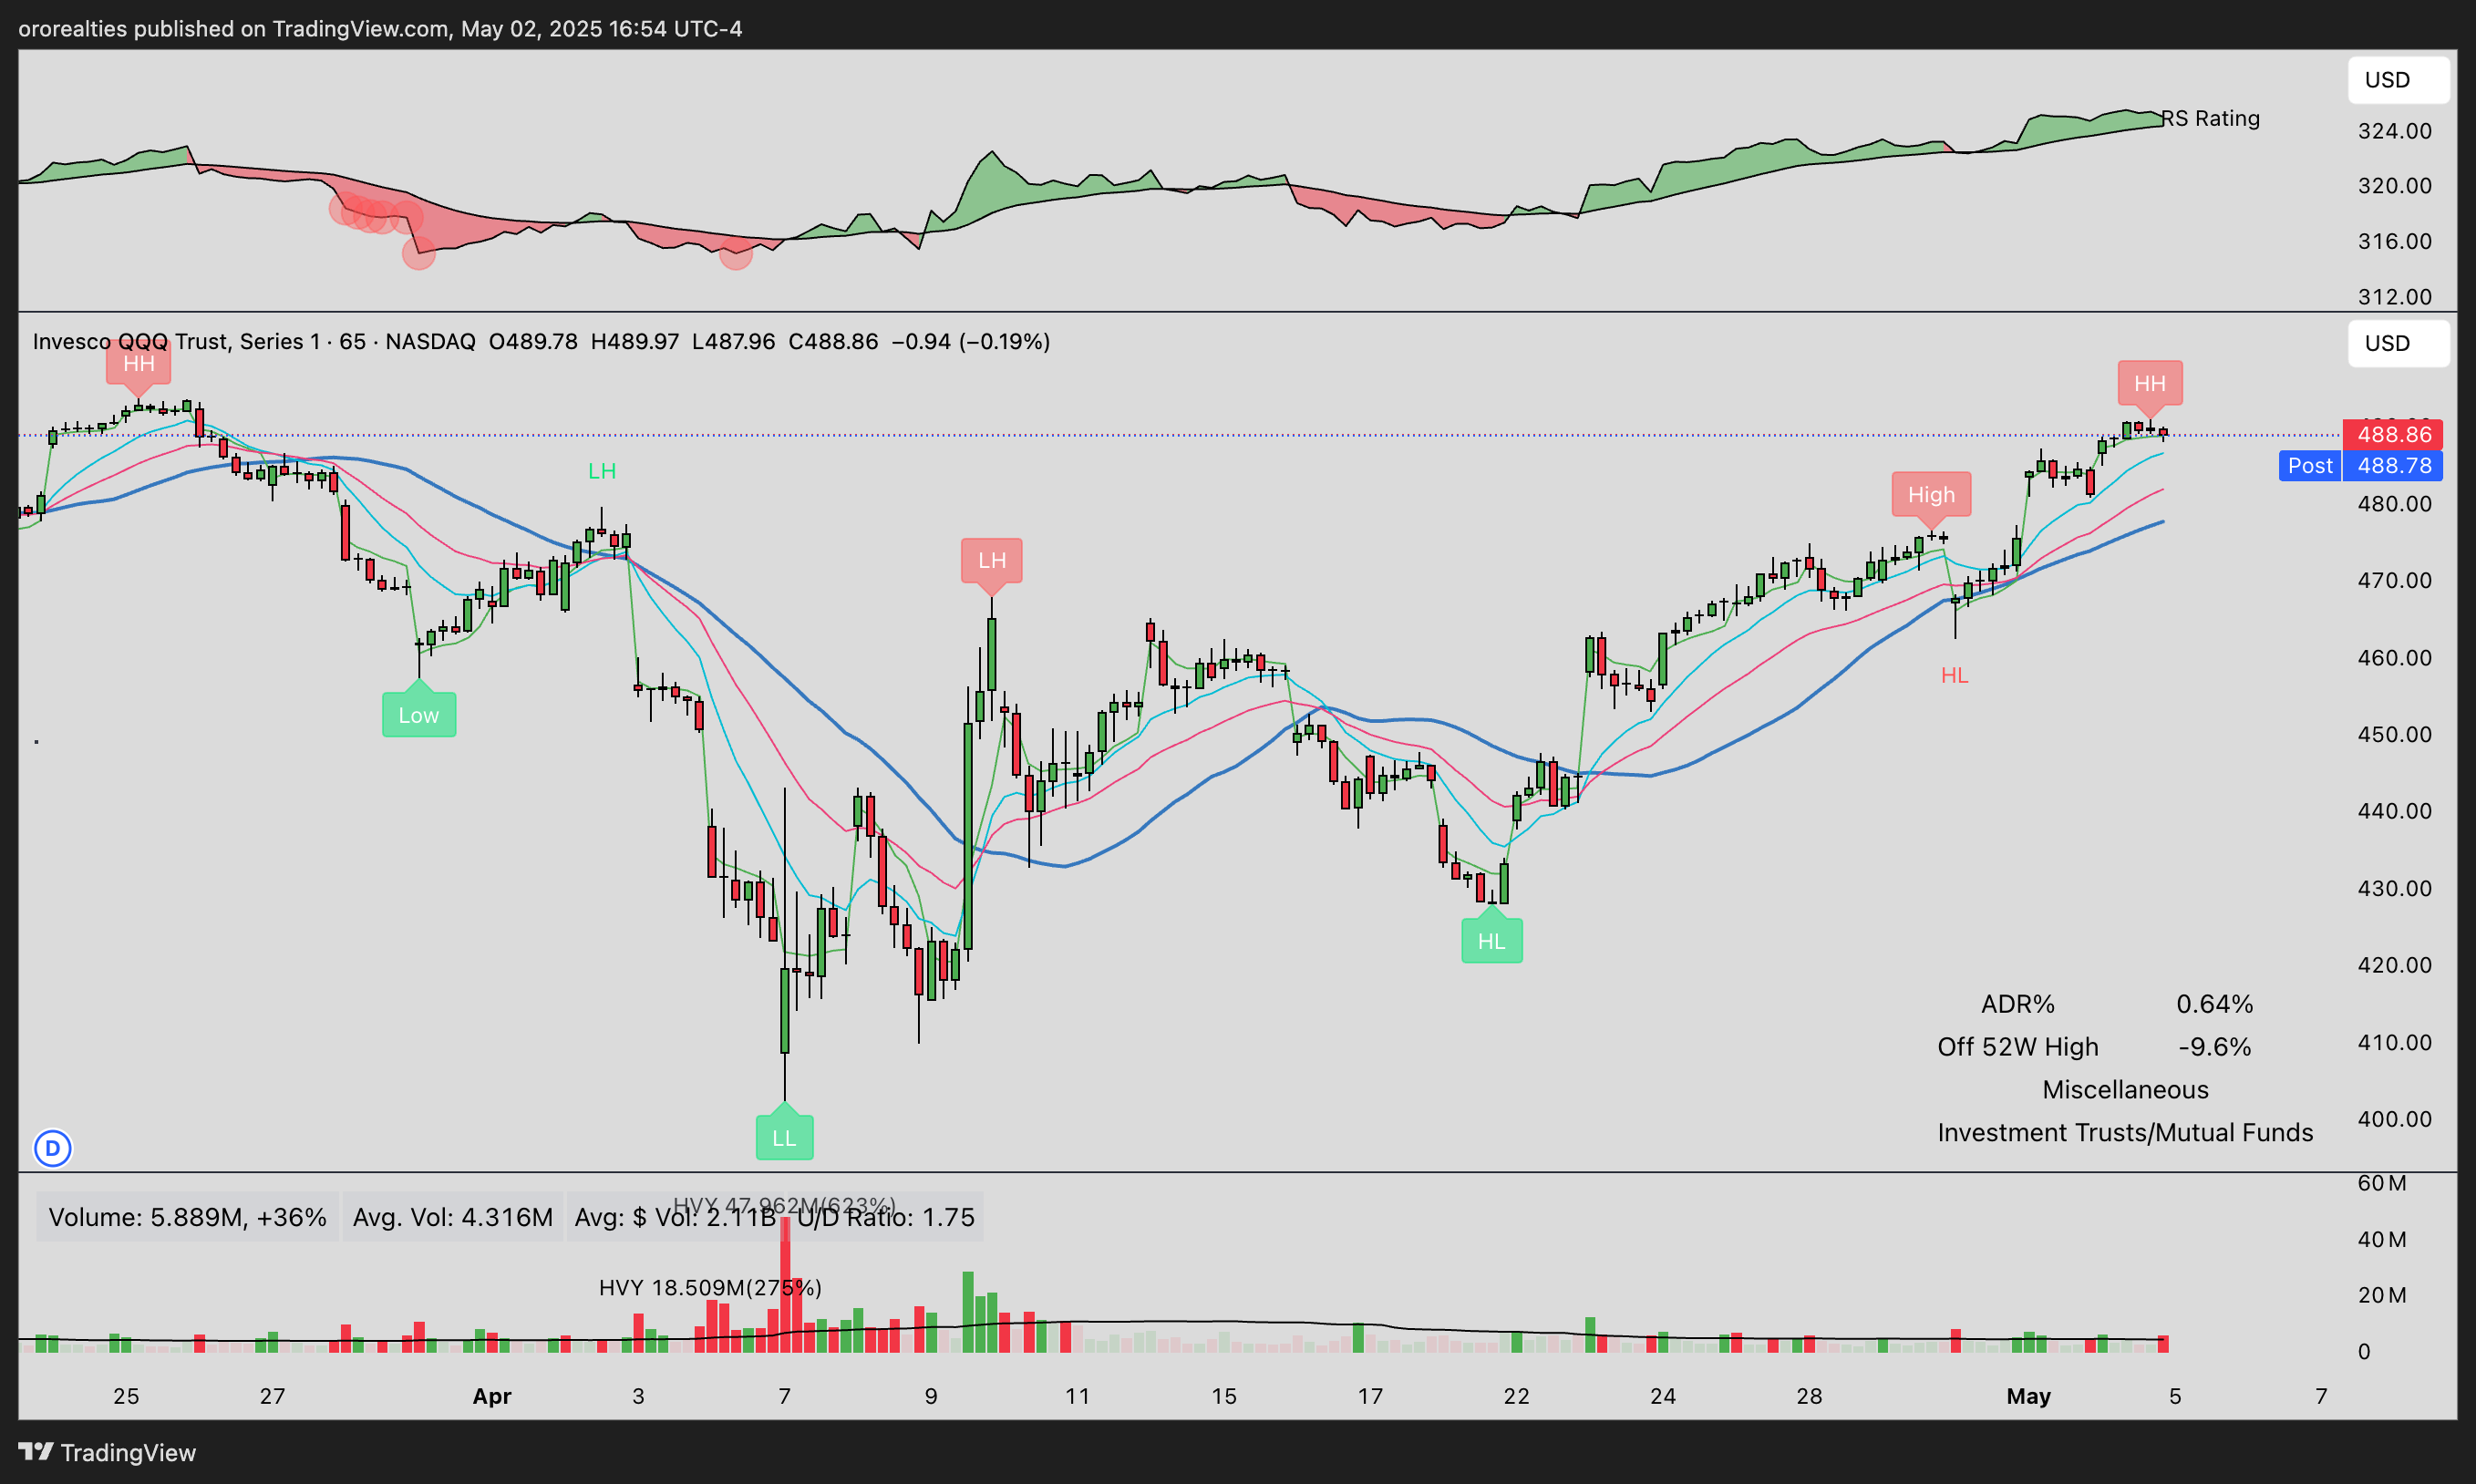
QQQ
QQQ had another tremendous week, blasting through resistance at the 50 SMA and running straight to the 200-day moving average.
What is extended can remain extended for longer than you think, and it would not shock me for this rally to continue.
However, from a risk-to-reward standpoint, it is possible we’ll see a pullback in the coming days.
A few days of sideways action here would be fantastic and could set up some new pivot points on the leading stocks as well as the index if it can blast through the 200-day.
The lockout rally has been tremendous, but it will at some point pull back and digest, and that is when I am looking to swoop in and get aggressive.

The 65-minute chart:
SPY
SPY powered higher this week and is now marching toward resistance at the 200-day moving average.
As noted above, some rest would be very healthy for this index and allow for some constructive patterns to form in leading stocks.
Great things started happening when price recovered the 10 and 21 EMA, and it’s been an incredible reminder of the value of that simple indicator. It will be interesting to see what happens here as we approach resistance.

IWM
A phenomenal end to the week with the IWM breaking above and closing above the 50-day moving average for the first time since December!
This is a great sign for the market if small caps can start performing.
This index saw a calmer ascent this week, and perhaps now it could be ready to make a run higher. There is lots of room to move until the 200-day above.

Gold
Gold is hanging around at the 21 EMA and looks vulnerable to a break lower here. This trend is clearly taking a breather, and there’s nothing to do but let this play out.

Bitcoin (long)
Bitcoin continues to look great as it clears this short-term range and pushes toward resistance at 98,000 to 100,000.
I’m expecting price to meet a little bit of difficulty there; however, a breakout above that really sets us up nicely for a move to challenge the highs.
I’m very bullish on this asset as it has acted extremely well from the start of this correction.
The relative strength line tells the whole story, and let’s see now if a sustained trend can develop here. We are heavily sized and de-risked in this position.

USD
The dollar shook out below yesterday’s low and rallied, printing a hammer candle just under the 21 EMA. Perhaps we might see a breakout next week.

TNX
After a week of pulling back, the 10-year yield saw a big breakout on Friday, shooting it back above all moving averages.
Are yields looking to wake up and get moving again?


Our market indicator
Flips to a GREEN signal.
We are finally back to a green signal, as the market rally charges on.
Resistance lies right above, but if we can digest nicely here, we may have a shot at further upside upon breaking above the 200-day.
Notice how much better price action got one we flipped to YELLOW/GREEN?

Qullamaggie indicator
Our Qullamaggie indicator remains RISK ON.
Trending beautifully above the moving averages.


SKFD
A strong rally to end the week put this reading straight back into bullish territory. As we’ve discussed for a couple of days now, a digestion is needed here.

NCFD
A big push straight back to the upper end of the range as this market refuses to cool down. Both oscillators are quite extended here.

NASI
Remains on a BUY signal.
Trending higher very nicely. We’ve tapped into ‘oversold’ on the RSI, something to be mindful of here.

FINVIZ market snapshot


1 week performance heat map

Stay in sync with the market. Get daily market and hot theme review, actionable trade ideas, nightly video and more straight to your inbox.

Deepvue theme tracker
A really powerful week in the market, with all but three sectors trading higher on the week.
Keep reading with a 7-day free trial
Subscribe to The Smart Stocks Newsletter to keep reading this post and get 7 days of free access to the full post archives.