


Pullbacks: What to do, when & to how buy them, how I trade them
Rejection, or breakout at the 200-day? Popcorn time.

The monster rally continued with the market gapping higher on the back of some impressive tech earnings — The bad news? We closed near the lows.
Is a pullback coming? Some rest surely would be acceptable here.
Sentiment is running hot, and leaders look fantastic, but a huge potential hurdle lies in wait just above: the 200-day moving average.
This is exactly where the bounce was previously stuffed, and the market now faces that same test. Will we see rejection, or can we see a breakout and follow-through to keep this trend alive?
Earnings season is alive and well!
Tonight we’ll be focusing on: Trading pullbacks, earnings gappers for tomorrow, exactly how I’d like to see the market rest, what types of setups we’ll be looking for, and the key names I am considering for future entries.
Let’s go!

QQQ
QQQ saw a great move decisively through the 50 SMA, a key resistance level.
This short-term rally is now quite extended as we push closer toward the major 200 SMA that is just above.
I believe it is very difficult to get aggressive right here, as the risks of a market rejection at this level are elevated.
When placing trades, we always want to think about risk versus reward, and after ripping higher for a week and a half straight, it feels like a pause may be necessary for us to see much further upside.
A pullback to the 50-day or even further would help reset many of these extended charts. The setups will always guide us, and many names are simply extended right now. We want the leaders, not the laggards.

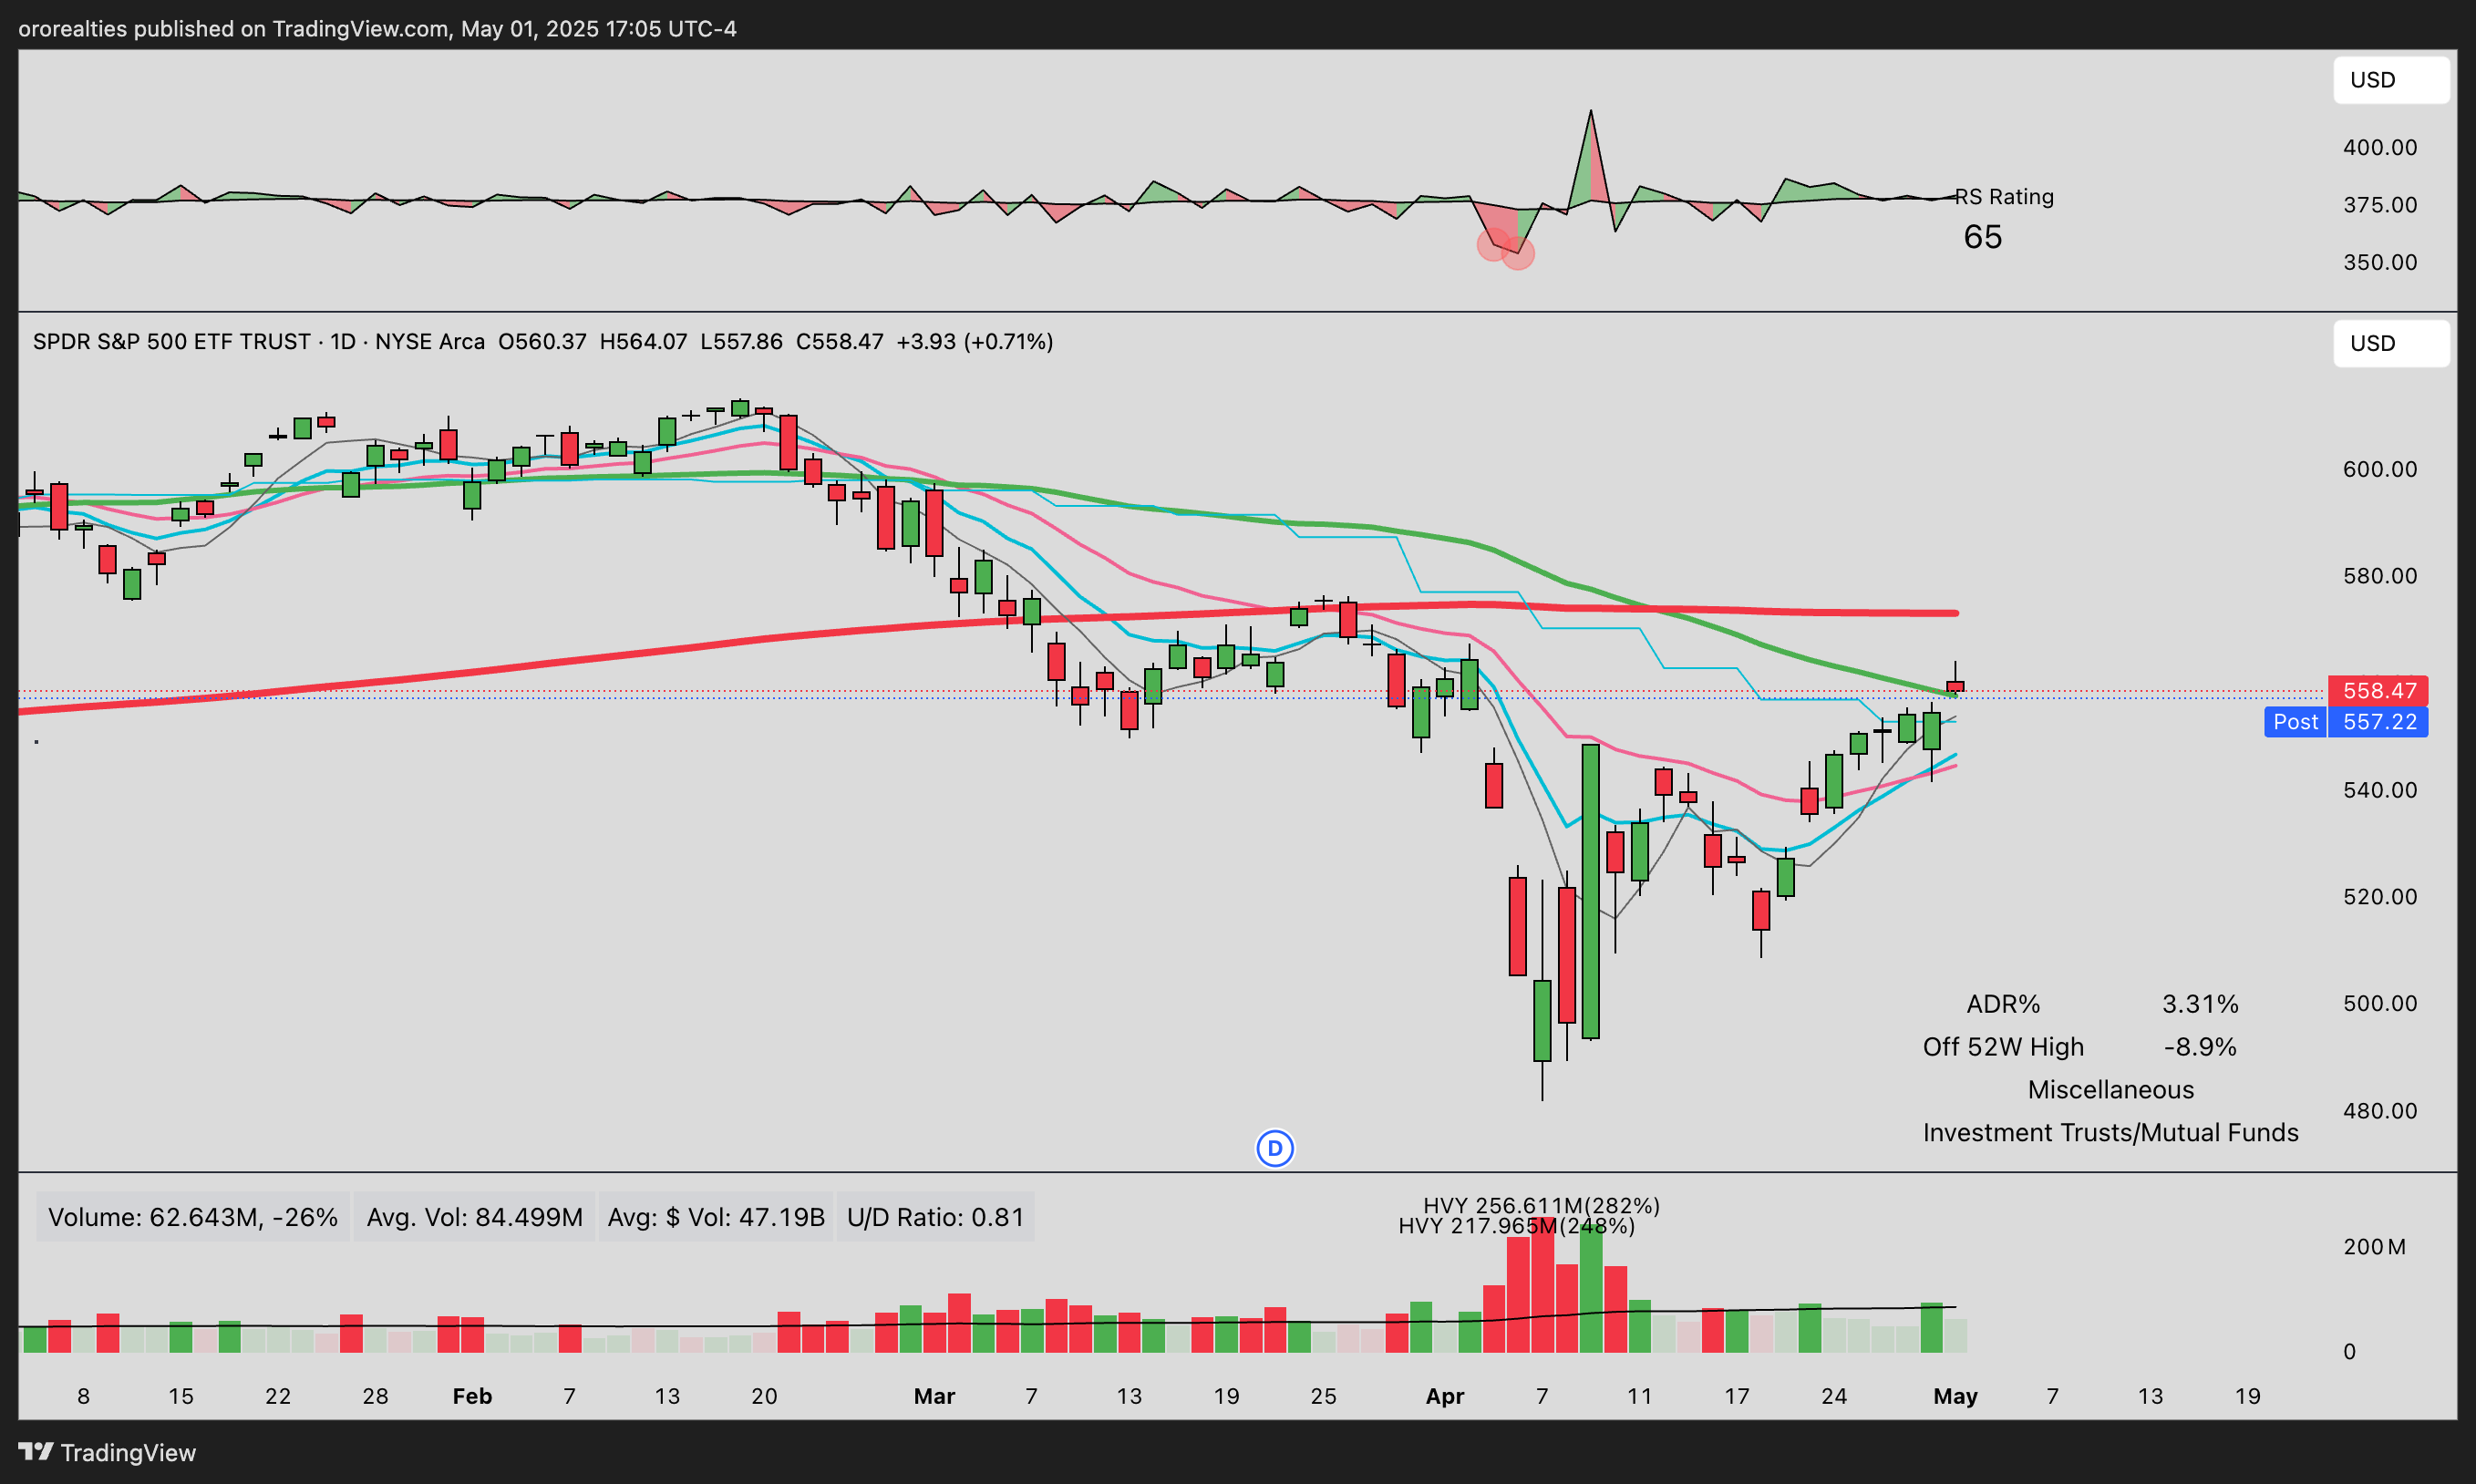
SPY
SPY is back above its 50-day average for the first time since March.
It's been a great run from the bottom, and now I would like to see some sideways consolidation. Consolidations are critically important as they help build new structure and form new setups from which we can enter positions.
Now that we've reclaimed the 50-day, I would like to see the support level hold, and it's very possible it will be tested in the coming days. The next test, of course, will be the 200-day moving average that is lurking above.
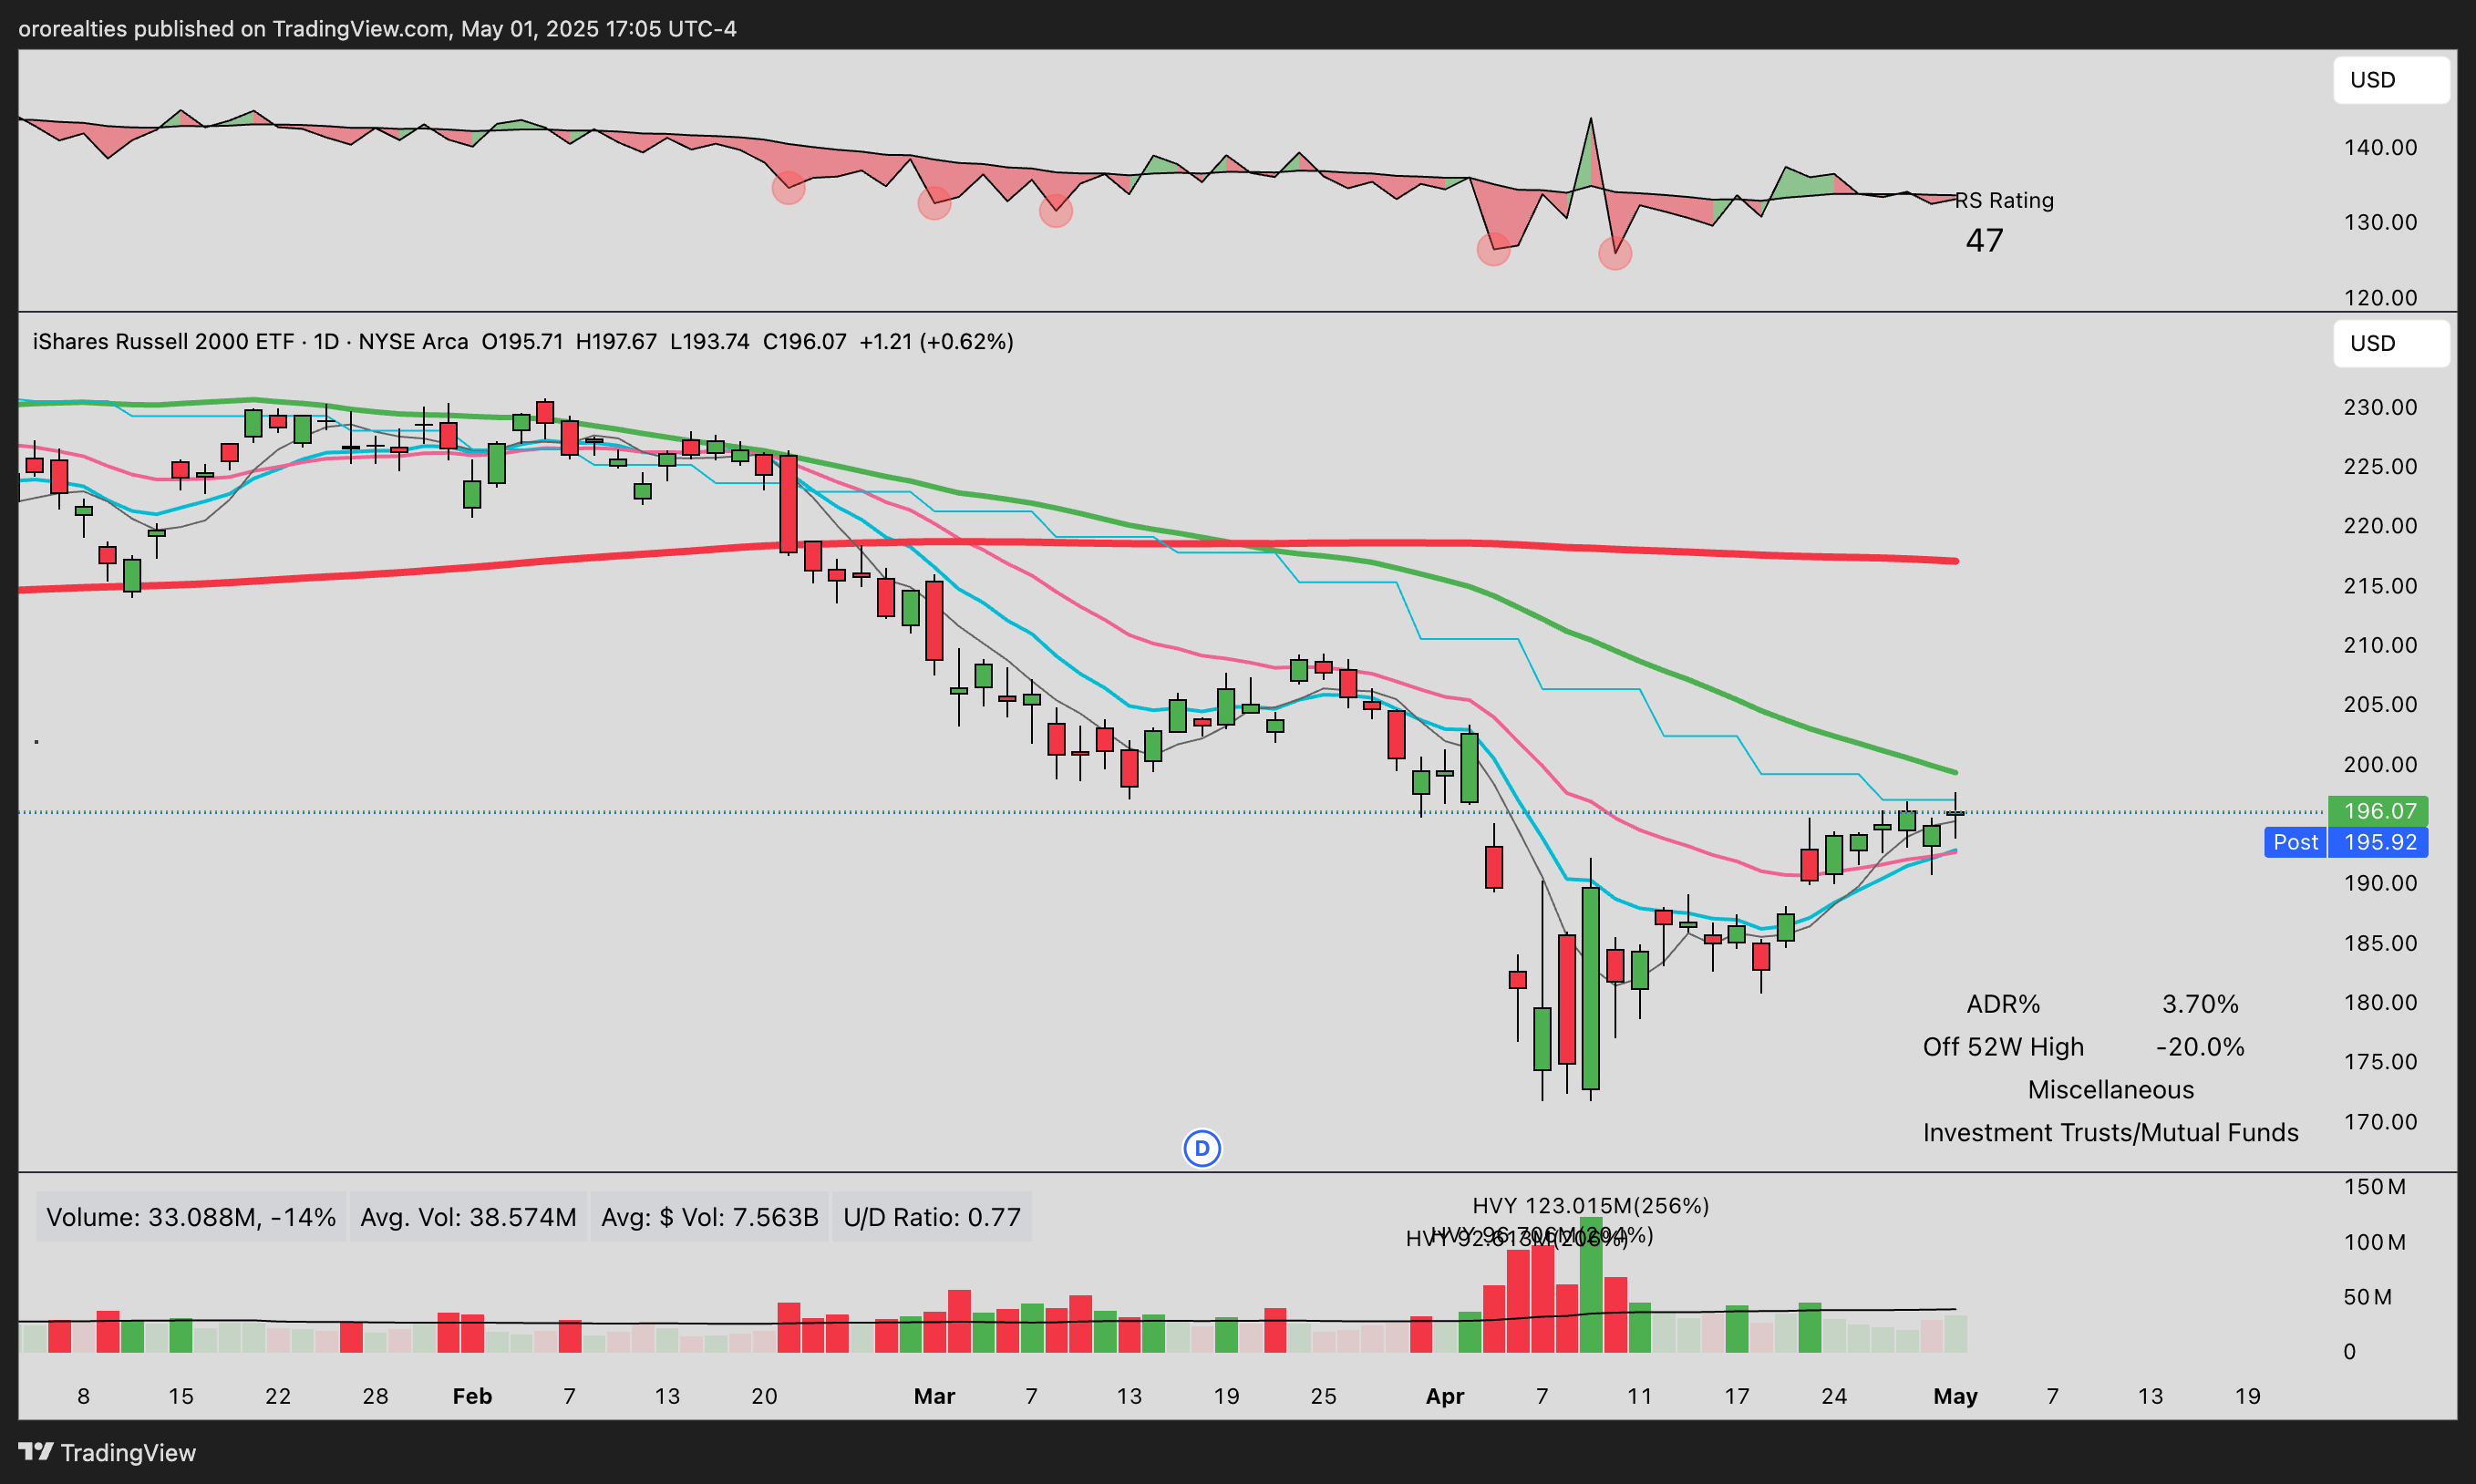
IWM
IWM is once again testing its 10-week moving average, printing a hammer candle. It's been a steady grind higher after getting back above the 10 and 21 EMA, which has been constructive.
Once price gets above the 50 and 10-week moving averages, there is a chance for more upside in this rally, and I move toward the 200-day. Of course, let's take things day by day.
Gold
Gold finally saw the breakdown as it slipped below the 21 EMA and support that had been holding this range.
Perhaps now we may see the downside move accelerate and the blow-off play out. Bulls will want to see a shakeout here and a reclaim of the 21 EMA to have a shot at keeping the move alive.

Bitcoin (long)
Bitcoin continues to show fantastic price action as it breaks out of the 96,000 level and pushes the range.
We added to our position this morning after a very tight multi-day consolidation. If price can clear 98,000, then there is a clean run toward the all-time high.
Let's see what it has in the tank!

USD
The dollar finally pushed above the 10 EMA resistance that had been holding it down for weeks, and it’s heading toward the 21 EMA.
Let's see how price reacts around this level.

TNX
Yields pushed higher today after shaking out below yesterday's lows. Price is currently battling with the 200-day moving average and a heavy congestion area.


Our market indicator
Remains on a YELLOW signal.
We continue to chase that illusive GREEN signal - patience.
If the market is preparing to digest here, LET IT. On the turn back up higher, if we get one, that’s when we’ll want to see net highs rip back into gear.

Qullamaggie indicator
Our Qullamaggie indicator remains RISK ON.
We are seeing some really nice price action following the cross of the 10 and 21 EMA.
This simple trend-following indicator helps highlight healthier index conditions, and we've seen it play out nicely in the last few days.


SKFD
The market has been running higher for a week and a half, and we await a cooling off in our breadth tools.

NCFD
A bounce from neutral readings as we push back up into the upper range of the oscillator.
Keep reading with a 7-day free trial
Subscribe to The Smart Stocks Newsletter to keep reading this post and get 7 days of free access to the full post archives.