MY 5 SETUPS
Success in the stock market comes down to consistently repeating a process that has an ‘edge’. Below are just about the only setups I use to buy stocks, my edge in buying the in the market.
1. The trendline breakout
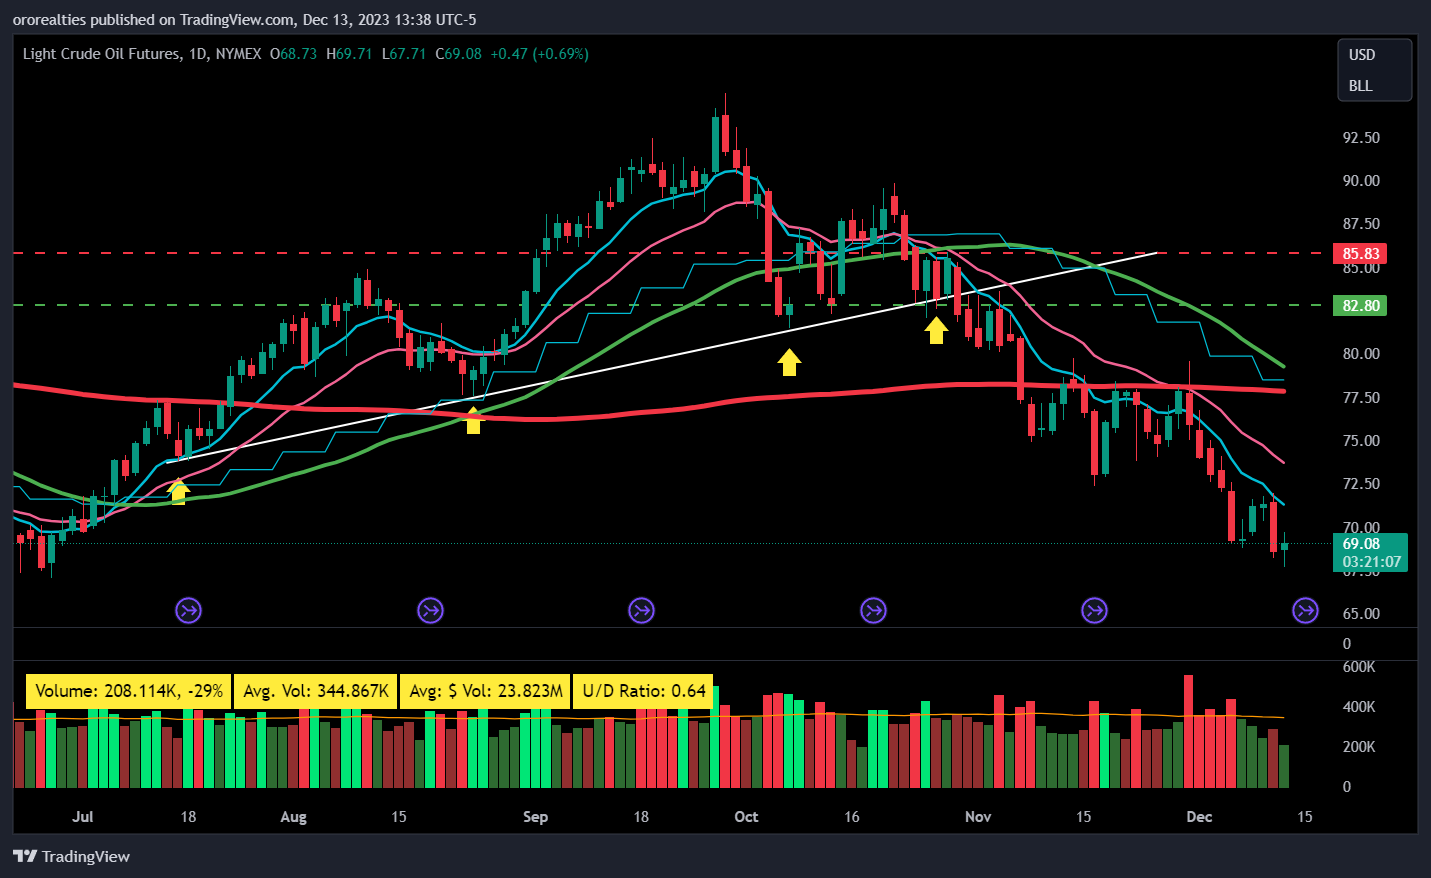
Explained: a trendline is a visual representation of support and resistance over time. The more touches on a trendline, the greater the support or the resistance. A valid trendline must offer at least 3 touches.
In the case of ABNB below, we can see there were 5 touches before a powerful breakout above the trendline occurred. Once this resistance was broken, the stock was able to move very quickly in the direction of the breakout.
Here’s another example with XRAY, where the trendline was cleanly tested multiple times and then once breached, we saw price appreciation.
Of course the same setup works to the downside for short selling. Here’s Crude Oil Futures
How to enter: You can enter in two ways:
As the trade as the high of the previous trendline touch is breached.
As soon as the trendline is breached
Setting stop losses: There’s two ways to play it. For tighter risk management, you can use the low of day of the breakout candle. To give the trade a little more room, you can use the prior days’ low.
2. The Inside day breakout
Explained: An inside day occurs when the current day’s high and low is within the prior day’s high and low. I use it as a continuation pattern that provides very low risk entries. The lower the volume on the inside day, the better. Let’s take a look.
Here with RCL you can see it produced an inside day with very quiet volume as it began to commence a new uptrend.
ENTRY: Once price takes out the prior day’s high
STOP LOSS: The breakout day’s low for a tighter stop, or prior day’s low for a wider stop
3. The EP setup
I first came across this setup by studying the work of Kristjan Kullamagi and Pradeep Bonde - all credit goes to these traders.
This setup occurs when unexpected good news hits a stock, creating a large gap up. When I first began studying gap ups, I was a little scared by them. “oh you can’t buy something gapping up 10,15%, it’s too extended” was my main thought. That’s why in trading and in life, you must always investigate, do your own research and due diligence, and only then will you have confidence. Let’s take a look!
Firstly, I use the 3 or 5 minute opening range high.
When a gaps up on earnings or other news, we wait for the first 3 or 5 minute candle to complete. If the stock takes out the opening range high AFTER the first 3/5 minutes, a buy signal occurs. If it does not, there is NO ENTRY SIGNAL. If triggered, a stop loss goes in at the low of day OR an arbitrary 3% loss (my personal risk tolerance), whichever is lower. Let’s take a look.
Here’s IOT, triggering around 9.50am. The stock closes the day with a 10.35% gain.
Here’s another example, LI
And now you can see it a few weeks later up 18%, which is 6x your initial risk
ENTRY: A move above the high of the first 3 or 5 minute candle. Some traders will even use a 1 minute opening range, but that will have a higher fail rate.
STOP LOSS: The low of day, or 3%: whichever is lower
4. The EMA pullback buy, or ‘second mouse’
This was the first setup I was taught by my mentor who got me into trading, He told me, “the second mouse gets the cheese”. What he meant is often breakout buyers are shaken out, and the stock will correct normally soon after, setting up a low risk entry point.
The stock pulls back into the rising 10 or 21 ema. Note here on GPS, making lower highs for 4 days in a row. Finally, on the fifth day, the stock bounces off the 10ema and a makes a new high.
Here’s META
The key takeaway is that if you miss a breakout or long run, there’s no need for FOMO. Be patient as a pullback buy is likely to setup at some point.
5. The Flat Pivot
This setup keys on the existence of a clean horizontal pivot point, and can be described as your classic breakout. You’re looking for a stock that is trading sideways, forming a tight base with volume gradually decreasing through time. Let’s examine.
Here’s DECK - Notice price getting nice and tight before the breakout and volume really decreasing.
Like all the setups that I use, they work on all timeframes. Here’s COIN on a weekly chart
ENTRY: Above the high of the consolidation
STOP LOSS: The low of day of the breakout candle, or for a wider stop loss, the prior day’s low
Closing comments:
All you need to do in the markets is find an edge and turn it over. These are time tested setups and the only ones I lean on. Identify favourable market conditions, scan the market, identify the setup, execute, rinse and repeat.


I was just curious to know would you play any type of inside bar? or do you want something specific to drive it up? Like a stock can form an inside day randomly as well, would you trade it? Thank you
Hi, do you ever set buy stops before market opens?
Or do you get an alert on your watchlist stock and then immediately place your order?
If alert hits right at market open, do you buy immediately? Or do you choose to wait first 10-15 minutes after market opens?
Sorry for all the questions. New member :)