


Indexes Crack Key Levels, But Lock In: The Hunt for Relative Strength Begins
Here's what to do when the market starts correcting!

Key takeaway: If you can’t make money in the leaders, you aren’t making money anywhere. A salmon can’t swim up Niagara Falls.
On Thursday, we sounded the alarm — and right on cue, Friday delivered a heavy selloff, with the indexes slicing straight through their short-term moving averages.
The writing has been on the wall.
For days, I’ve been highlighting the red flags and growing signs of market weakness.
If you’ve been paying attention to your watchlist, portfolio, and stock universe, you likely saw it too — because that’s the holy grail of trading: listening to the subtle (and sometimes loud) feedback the market gives you.
This weekend, I’ll dive deeper into how to refine that skill — the one that can help you sidestep selling and keep you aligned with the true market tone.
If you’ve been dialled in, you likely ended the week with a hefty cash position.
And if not? That’s okay — because this isn’t the time to be discouraged. It’s the time to get laser-focused.
Now we shift gears. This is when we zero in on the stocks showing real relative strength — the ones resisting the pullback.
These are your next leaders. The market always plants clues before the next move.
Join me this weekend for the treasure hunt.
Tonight, I’ll be breaking down:
RS leaders list
Video analysis of the charts
Key index levels, my thoughts
BTC/ETH update
How to spot trouble…in your own backyard
Refreshed watchlist
How to handle pullbacks
Let’s go!

QQQ
What started off as a very quiet week in the QQQ turned out to be a very heavy selling situation.
From coasting above the 10 EMA without a care in the world, this index saw decisive selling hit late in the week, with price now slicing through the 10 and 21 EMA and looking like a trip to the 50-day moving average could be on the cards.
It's incredible to think that this index has knocked out almost all gains from the month of July.
Now is a time where you must be extremely patient and eliminate this idea of buying the dip and being first in the pool.
A trip to the 50-day moving average could certainly be on the cards here, especially considering how weak mega caps are acting right now. Below the 21 EMA is a risk-off situation.

The 65-minute chart:

SPY
SPY was also the victim of some extensive selling as it logs three distribution days in a row and has now broken below the 21 EMA as well.
This index has also seen just about all the gains from July erased and now it remains under pressure.
Are we going to see a test of the 50-day moving average here? It certainly looks possible and I would not be diving in to call the bottom.
Price action like this instantly puts me into wait-and-see mode.
Perhaps we are going to see the bulls quickly get back in gear, but also let's understand that this market may need time to have a good rest here after an incredible trend.

IWM
IWM set off two warning shots on Wednesday and Thursday as it lost the 10 and then the 21 EMA on back-to-back days, both of which had above-average volume.
Friday saw an ugly down day; however, we did see some buying step in as the bulls bought it up off the low of the day.
It now sits in a very precarious position where it is right on the 50 and the 200-day moving average confluence.
Is this area going to become resistance? It is certainly possible.
We also have two unfilled gaps to work with from here. Bulls are going to have their hands full.

ARKK
ARKK was on very close watch for what would have been a very normal pullback buy. That would've been my ideal entry point for this chart.
On Friday we saw a very bad break of the 21 EMA, and now suddenly this chart is completely in no man's land, with no real support in sight.
We need to be patient and wait for some sort of contraction to occur right now, as this chart is definitely vulnerable to a bigger pullback.

Gold
Gold continues to display some very erratic price action as it chops up and down through the moving averages, completely trendless.
This type of price action is making it quite easy for us to sit out and avoid trading this commodity.
If we zoom out, it is building a large base on the weekly timeframe, so for now let's continue to observe.

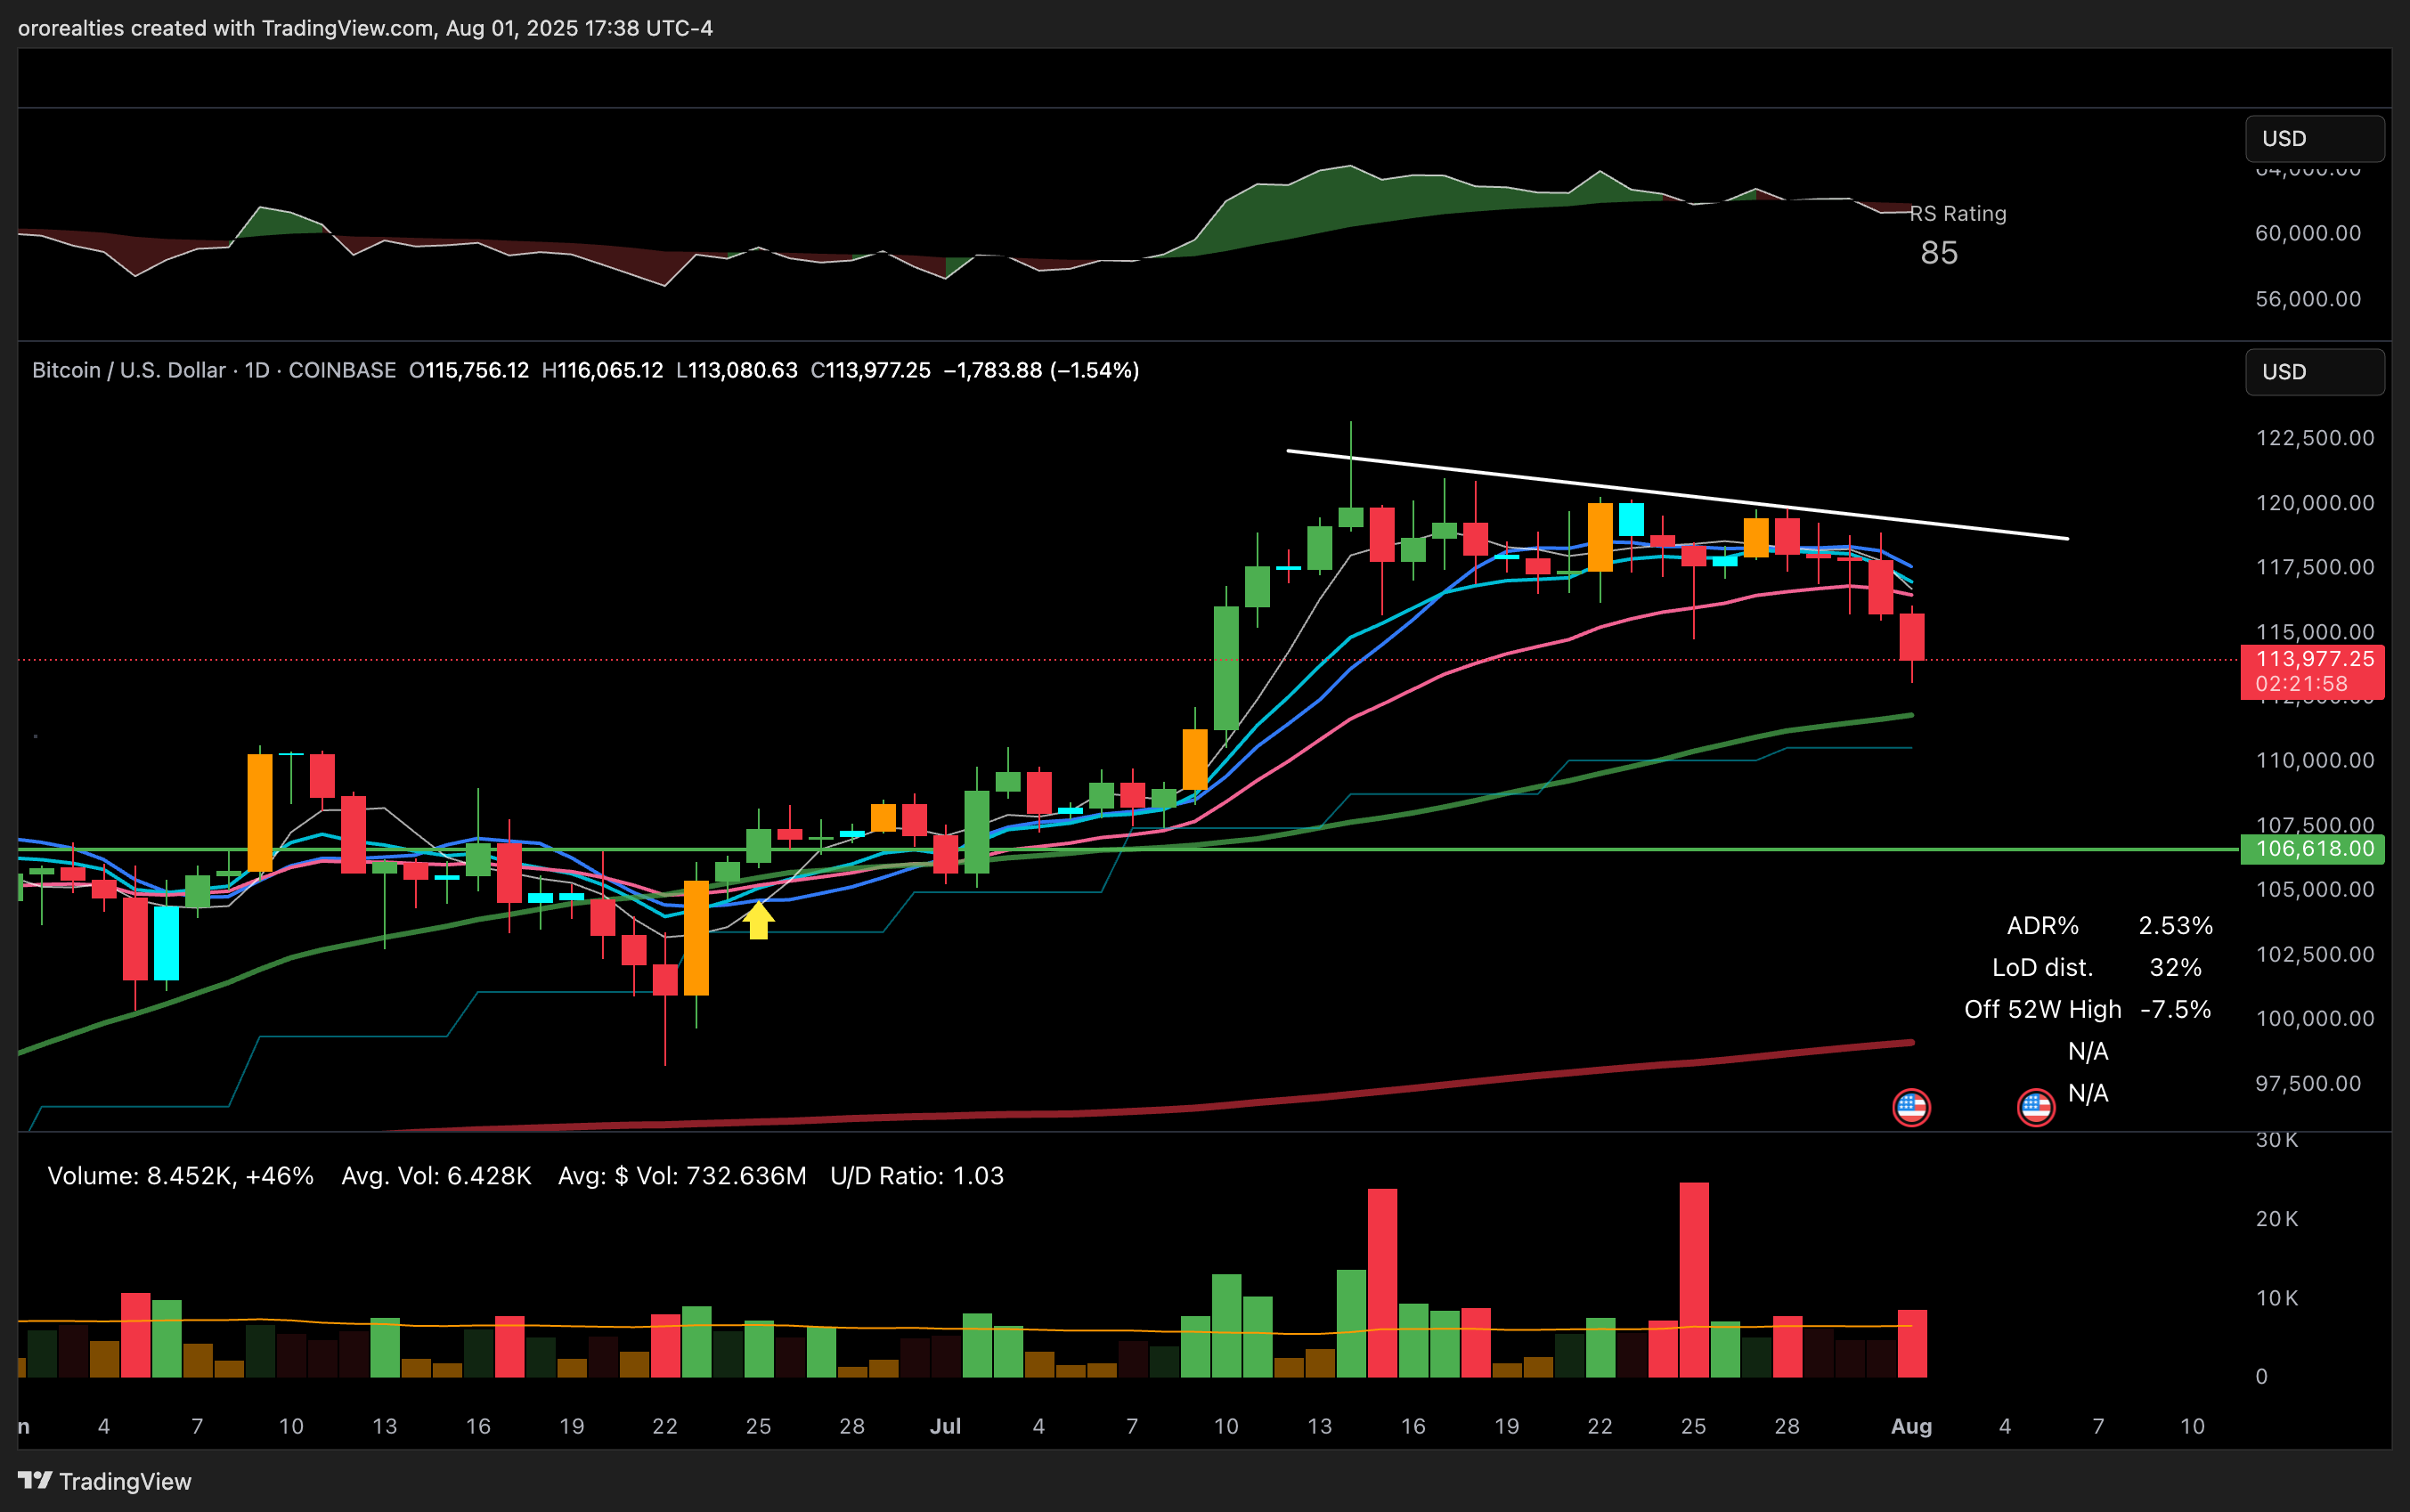
Bitcoin
On Thursday evening, our trade with Bitcoin came to an end as we locked in profits.
The close below the 21 EMA was the first warning shot, and after taking out the low of July 25 as well, that was all we needed to see to lock in our profits in Bitcoin.
This is a great example of why it's nice to have a thesis or an opinion, but price is the ultimate arbiter.
I will happily revisit a setup here if it digests on the 50-day moving average or once it gets back above the 10 and 21 EMA. I do not care how bullish the fundamentals are — price is the only thing that matters.
USD
The dollar’s rally was dealt a blow on Friday following some economic data that caused a pretty steep selloff.
It looks like it is retesting the moving averages from here, and let's see how it trades next week.

TNX
10-year yield saw a major breakdown on Friday, decisively flushing the range of the last week or two, and is now testing around the lows of July.
A very bearish candle, which indicates to me that yields could be going lower here.


Our market indicator
Keep reading with a 7-day free trial
Subscribe to The Smart Stocks Newsletter to keep reading this post and get 7 days of free access to the full post archives.